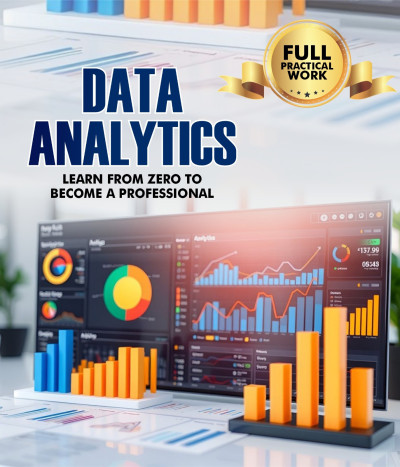
Data Analytics
You will learn the full concept of data analysis
English
Last updated
Wed, 18-Feb-2026
You will learn the full concept of data analysis
English
Last updated
Wed, 18-Feb-2026
Excel Course
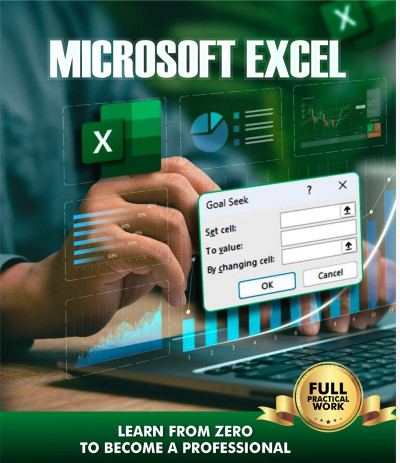
This Excel course is designed to equip learners with practical, job-ready Excel skills used in real business and data analysis environments. Participants will learn how to organize, clean, analyze, and visualize data using essential Excel tools and functions.
Students will gain hands-on experience with major Excel functions such as SUM, AVERAGE, COUNT, IF, SUMIF, COUNTIF, VLOOKUP, XLOOKUP, TEXT functions etc. The course also covers data cleaning techniques, sorting and filtering, conditional formatting, data validation, PivotTables, PivotCharts, and interactive dashboards.
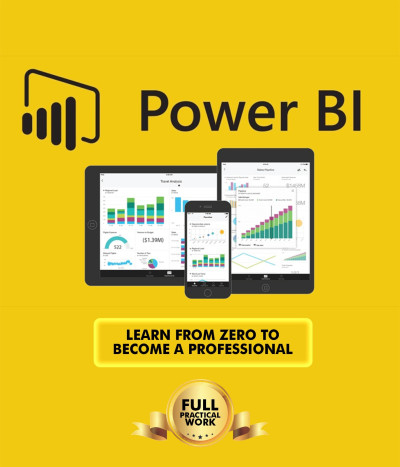
Power BI Course
This course equips learners with practical, in-demand skills for data analysis and reporting using Microsoft Power BI. Students will learn how to connect to different data sources, clean and transform data using Power Query, and create meaningful calculations using key DAX functions such as SUM, CALCULATE, IF, COUNT, and time-intelligence functions. The course also covers data visualization, interactive dashboards, charts, filters and slicers. Through hands-on exercises and real-world assignments, learners will gain the confidence to turn raw data into clear, actionable insights for business decision-making.
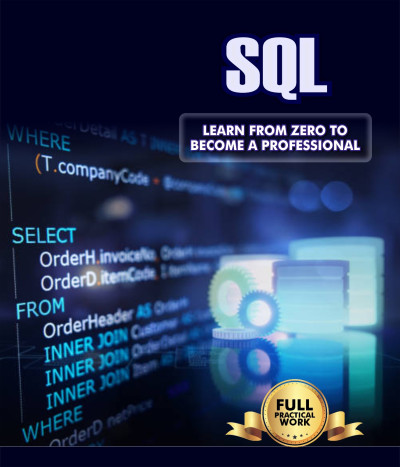
SQL Course
This course introduces learners to practical, job-ready skills for working with databases using Structured Query Language (SQL). Students will learn how to retrieve, filter, and analyze data using essential SQL commands such as SELECT, WHERE, ORDER BY, GROUP BY, HAVING, and JOINs. The course also covers aggregate functions like COUNT, SUM, AVG, MIN, and MAX, as well as subqueries and basic data manipulation using INSERT, UPDATE, and DELETE statements. Through hands-on exercises and real-world datasets, learners will gain the confidence to query databases, generate insights, and support data-driven decision-making in professional environments.


Study any topic, anytime. explore thousands of courses for the lowest price ever!